Studying stats? Practice makes perfect, so you’re in the right place. For additional help preparing for stats – or any other part of the GCSE maths exam – our professional GCSE maths tuition is the solution.
Each one-to-one session with TLC LIVE covers the topics that the student needs assistance with, and tutors draw from an extensive library of in-depth teaching resources. Here is a set of nine sample statistics GCSE questions from our library.
10 sample statistics GCSE questions
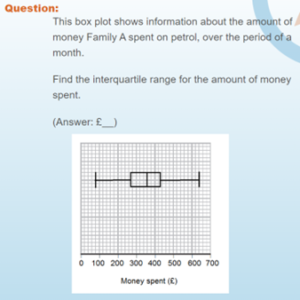
1. 
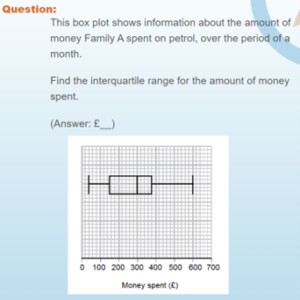
2. 
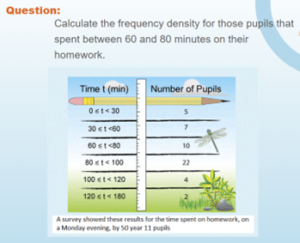
3. 
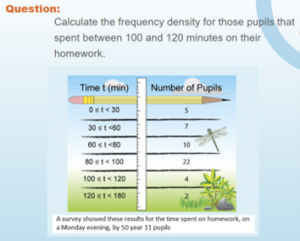
4. 
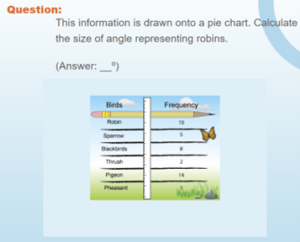
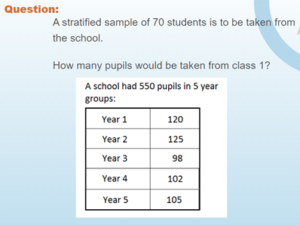
5. 
6. 
7. 
8.
9. 
10. 
Answers to our sample statistics GCSE questions
1. £160
2. £230
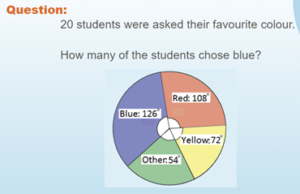
3. 5
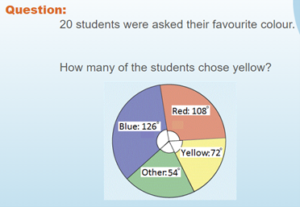
4. 2
5. 90⁰
6. 7
7. 4
8. 151
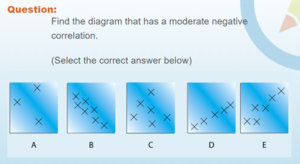
9. B
10. 15
Contact us for affordable, effective Statistics GCSE tuition
For support in trigonometry, algebra or any other maths topic – or maths as a whole – there’s no better option than professional online tutoring with TLC LIVE. Our one-hour online sessions directly connect students with qualified DBS (or equivalent) checked tutors for top-quality maths tuition.
In addition to working directly with parents, we are a preferred tuition provider for over 500 schools nationwide and a government-certified quality assured tuition partner.
Get in touch today to find out more about online tutoring for schools.
Written by Ryan Lockett, director of studies at TLC LIVE.